Quickly visualize your Django schemas with DjangoViz
DjangoViz has been deprecated. Please refer to the Atlas Django Provider documentation for up to date instructions.
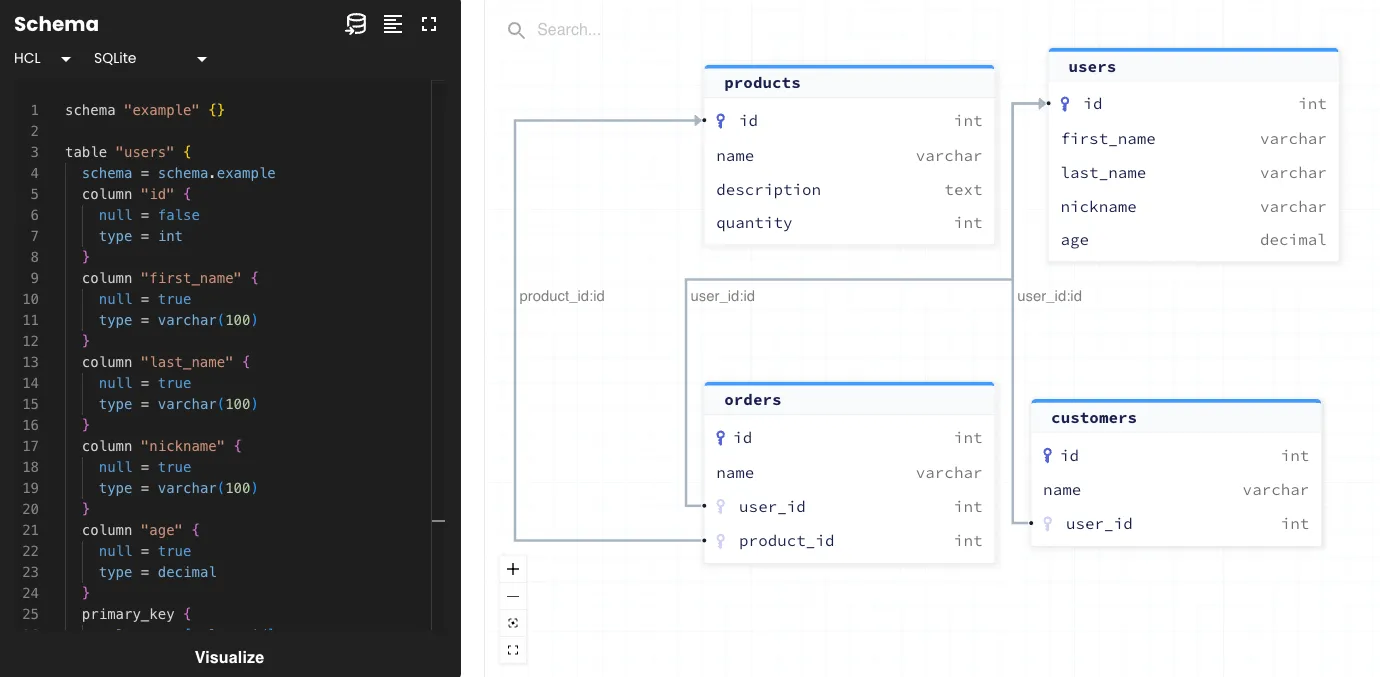
Having a visual representation of your data model can be helpful as it allows for easier comprehension of complex data structures, and enables developers to better understand and collaborate on the data model of the application they are building.
Entity relationship diagrams (ERDs) are a common way to visualize data models, by showing how data is stored in the database. ERDs are graphical representations of the entities, their attributes, and the way these entities are related to each other.
Today we are happy to announce the release of DjangoViz, a new tool for automatically creating ERDs from Django data models.
Django is an open source Python framework for building web applications quickly and efficiently. In this blog post, I will introduce DjangoViz and demonstrate how to use it for generating Django schema visualizations using the Atlas playground.
Django ORM
Django ORM is a built-in module in the Django web framework. It offers a high-level abstraction layer that enables developers to define complex application data models with ease. Unlike traditional ORM frameworks that rely on tables and foreign keys, Django models are defined using Python objects and relationships:
from django.db import models

class User(models.Model):
    username = models.CharField(max_length=255)
    email = models.EmailField(unique=True)
    password = models.CharField(max_length=255)

class Post(models.Model):
    title = models.CharField(max_length=255)
    content = models.TextField()
    author = models.ForeignKey(User, on_delete=models.CASCADE)
When the application runs, Django translates these Python models into database schemas, mapping each model to a
corresponding database table and each field to a corresponding column in the table.
When working with schemas and making changes to them, being able to understand the full picture just through code can
get complicated very quickly. To help developers better understand their schema, we have created DjangoViz.
Introducing DjangoViz
For the purpose of this demo, we will follow the Django getting started tutorial,
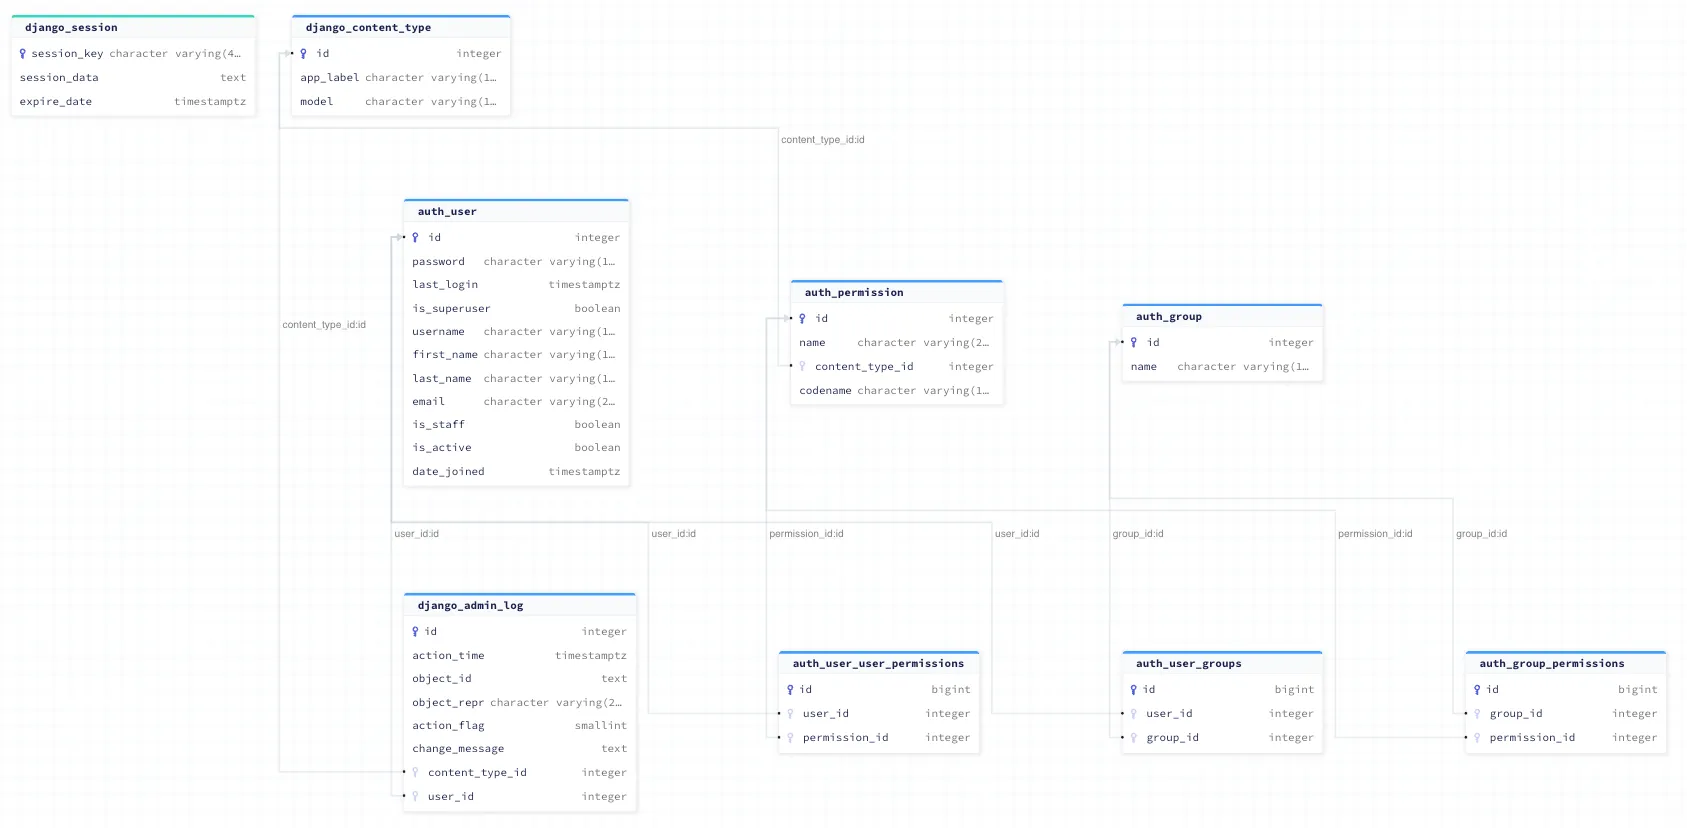
and showcase how you can use DjangoViz to visualize the default models included by Django's startproject command.
First, install Django and create a new project:
pip install Django
django-admin startproject atlas_demo
cd atlas_demo
Install the DjangoViz package:
pip install djangoviz
Add DjangoViz to your Django project's INSTALLED_APPS in atlas_demo/settings.py:
INSTALLED_APPS = [
    ...,
    'djangoviz',
    ...
]
DjangoViz supports either PostgreSQL or MySQL, in this example we will use PostgreSQL:
Install the PostgreSQL driver:
pip install psycopg2-binary
Configure the database to work with PostgreSQL in the settings.py file:
DATABASES = {
   "default": {
       "ENGINE": "django.db.backends.postgresql_psycopg2",
       "NAME": "postgres",
       "USER": "postgres",
       "PASSWORD": "pass",
       "HOST": "127.0.0.1",
       "PORT": "5432",
   }
}
Start a PostgreSQL container:
docker run --rm -p 5432:5432 -e POSTGRES_PASSWORD=pass -d postgres:15
Now, you can visualize your schema by running the djangoviz management command from your new project directory:
python manage.py djangoviz
You will get a public link to your visualization, which will present an ERD and the schema itself in SQL or HCL:
Here is a public link to your schema visualization:
  https://gh.atlasgo.cloud/explore/ac523fef
When clicking on the link you will see the ERD of your new project:
Wrapping up
In this post, we discussed DjangoViz, a new tool that helps to quickly visualize Django schemas. With this tool, you can easily get an overview of the data model and visual of your schema. We would love to hear your thoughts and feedback if you decide to give it a go!
Have questions? Feedback? Find our team on our Discord server ❤️.

