How Atlas Schema Monitoring Works: Architecture, Agents, and Key Features
Overview
This document provides an overview of how Atlas Schema Monitoring works. It describes the high-level architecture, key capabilities and features. Learn how Atlas enables secure and effective database schema monitoring.
Architecture
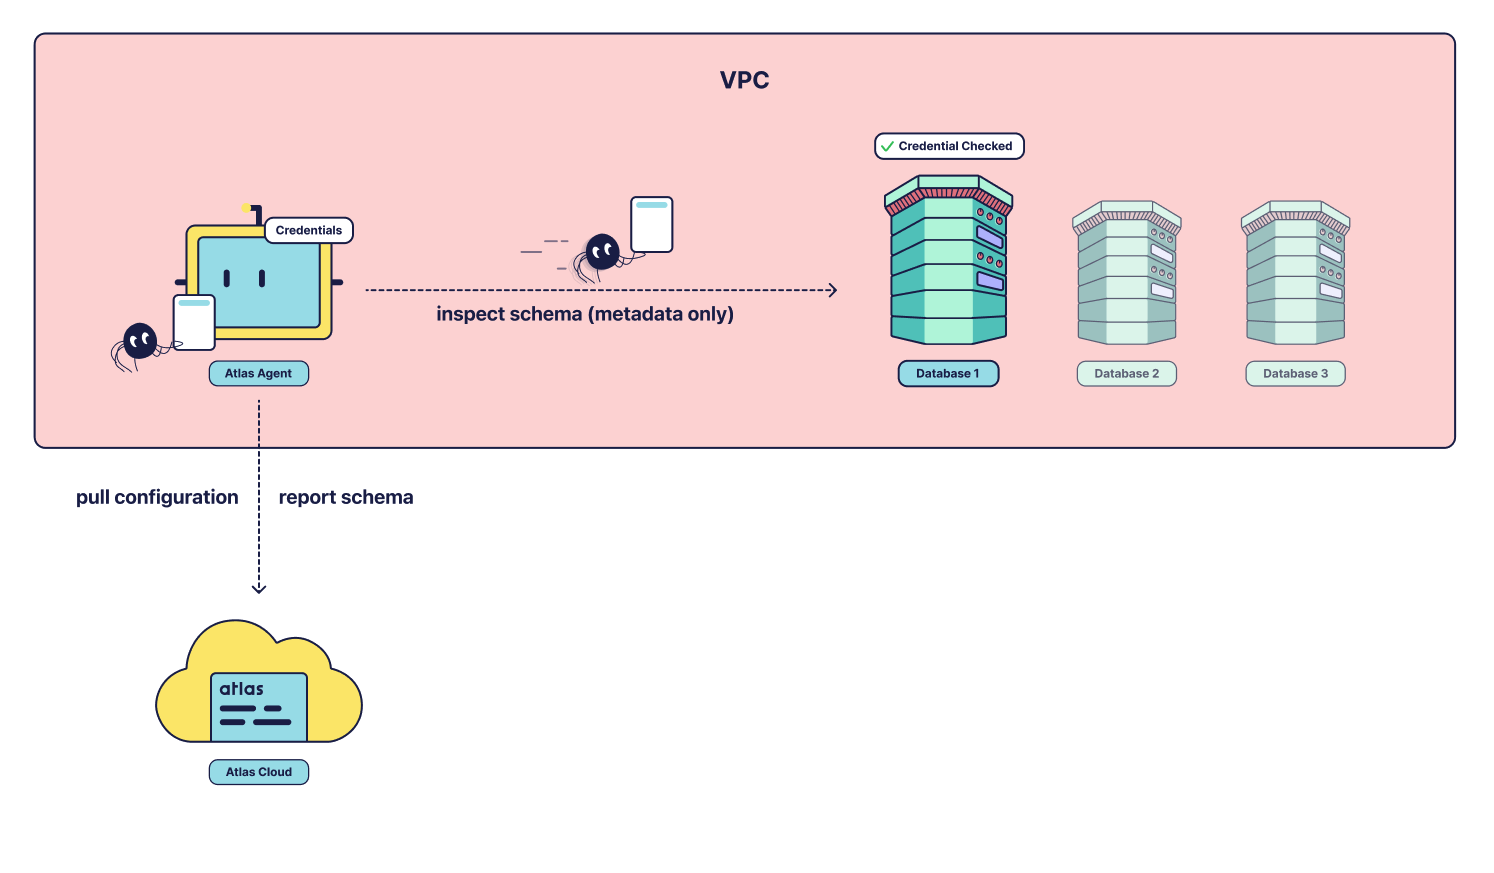
Atlas Cloud never has direct access to your database. Instead, it uses a middleman—the Atlas agent—to connect to your
database. In order for this to work, the agent needs to be installed somewhere with network connectivity to the
database, usually within the same VPC as the database. In addition, the agent should have outbound connectivity to your cloud account (e.g., https://<tenant>.atlasgo.cloud).
The agent then starts polling Atlas Cloud for work. Once assigned a task, it connects to the database and executes the task (e.g., "take a snapshot") and then reports back the result to Atlas Cloud. The agent does not read or report back any user data, only metadata about the database schema.
Key Capabilities
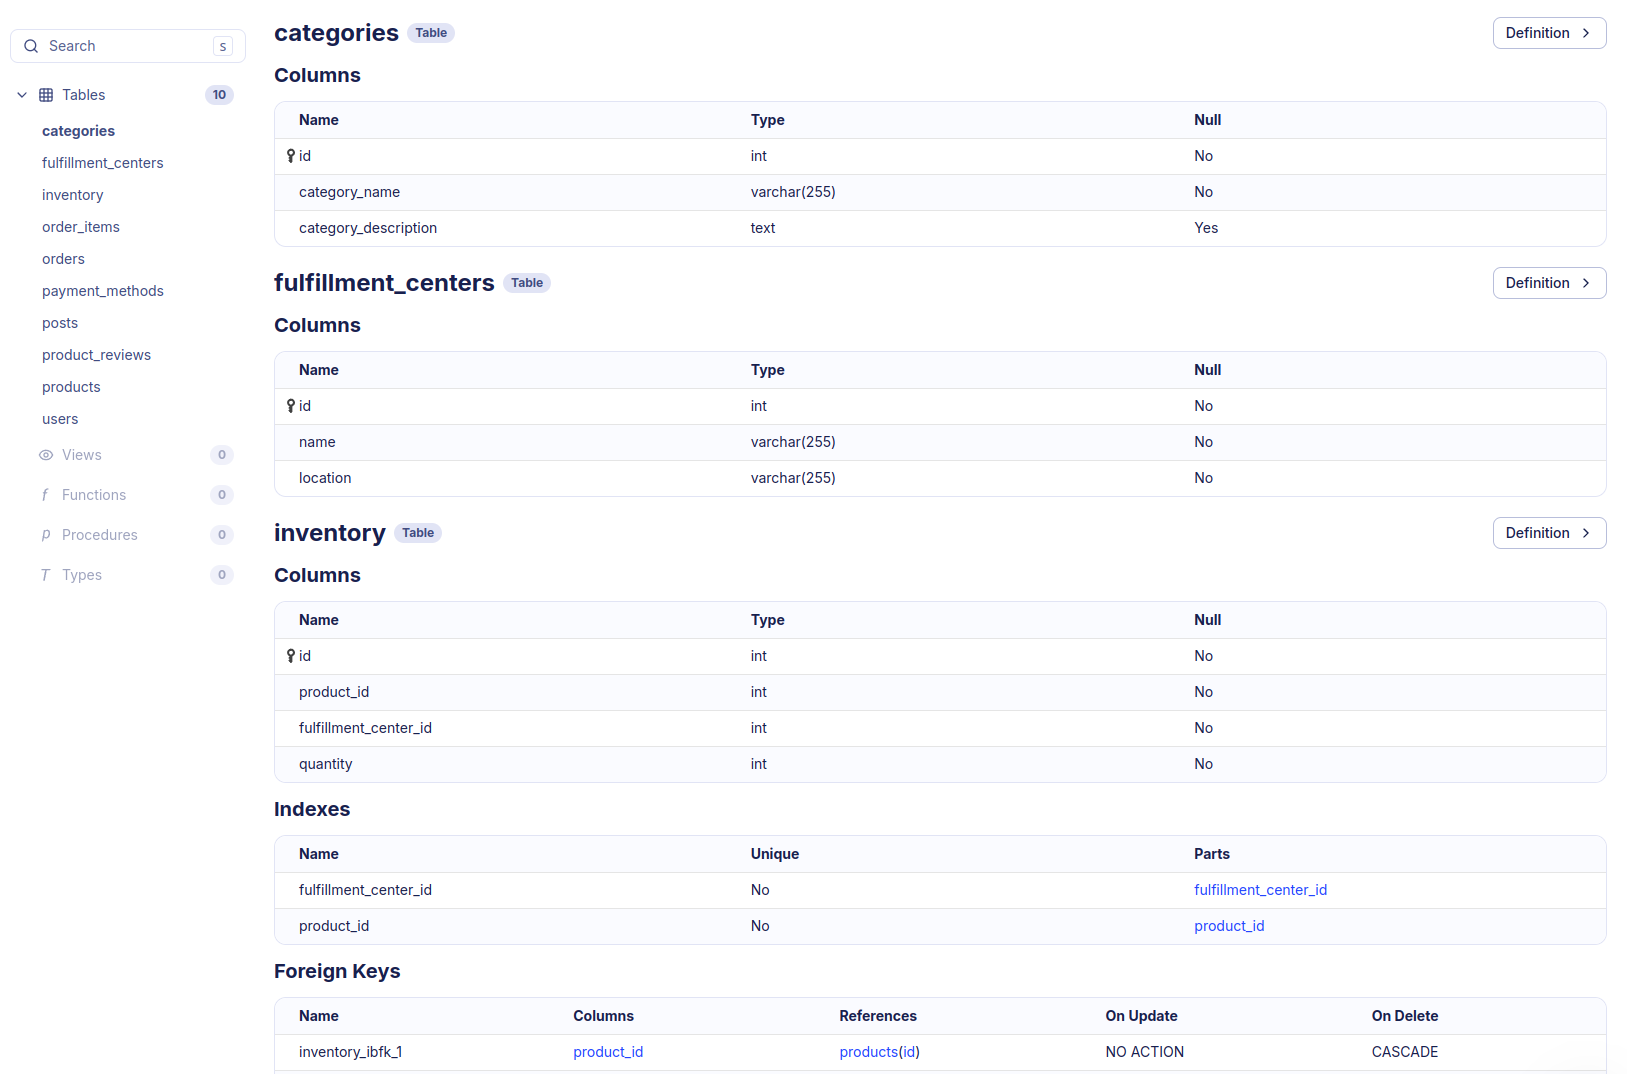
Documentation
Schema Monitoring provides a set of tools and features to help you manage and monitor your database schema effectively. In addition to a nice ERD visualization of your database schema, you get auto-generated documentation of your database schema.

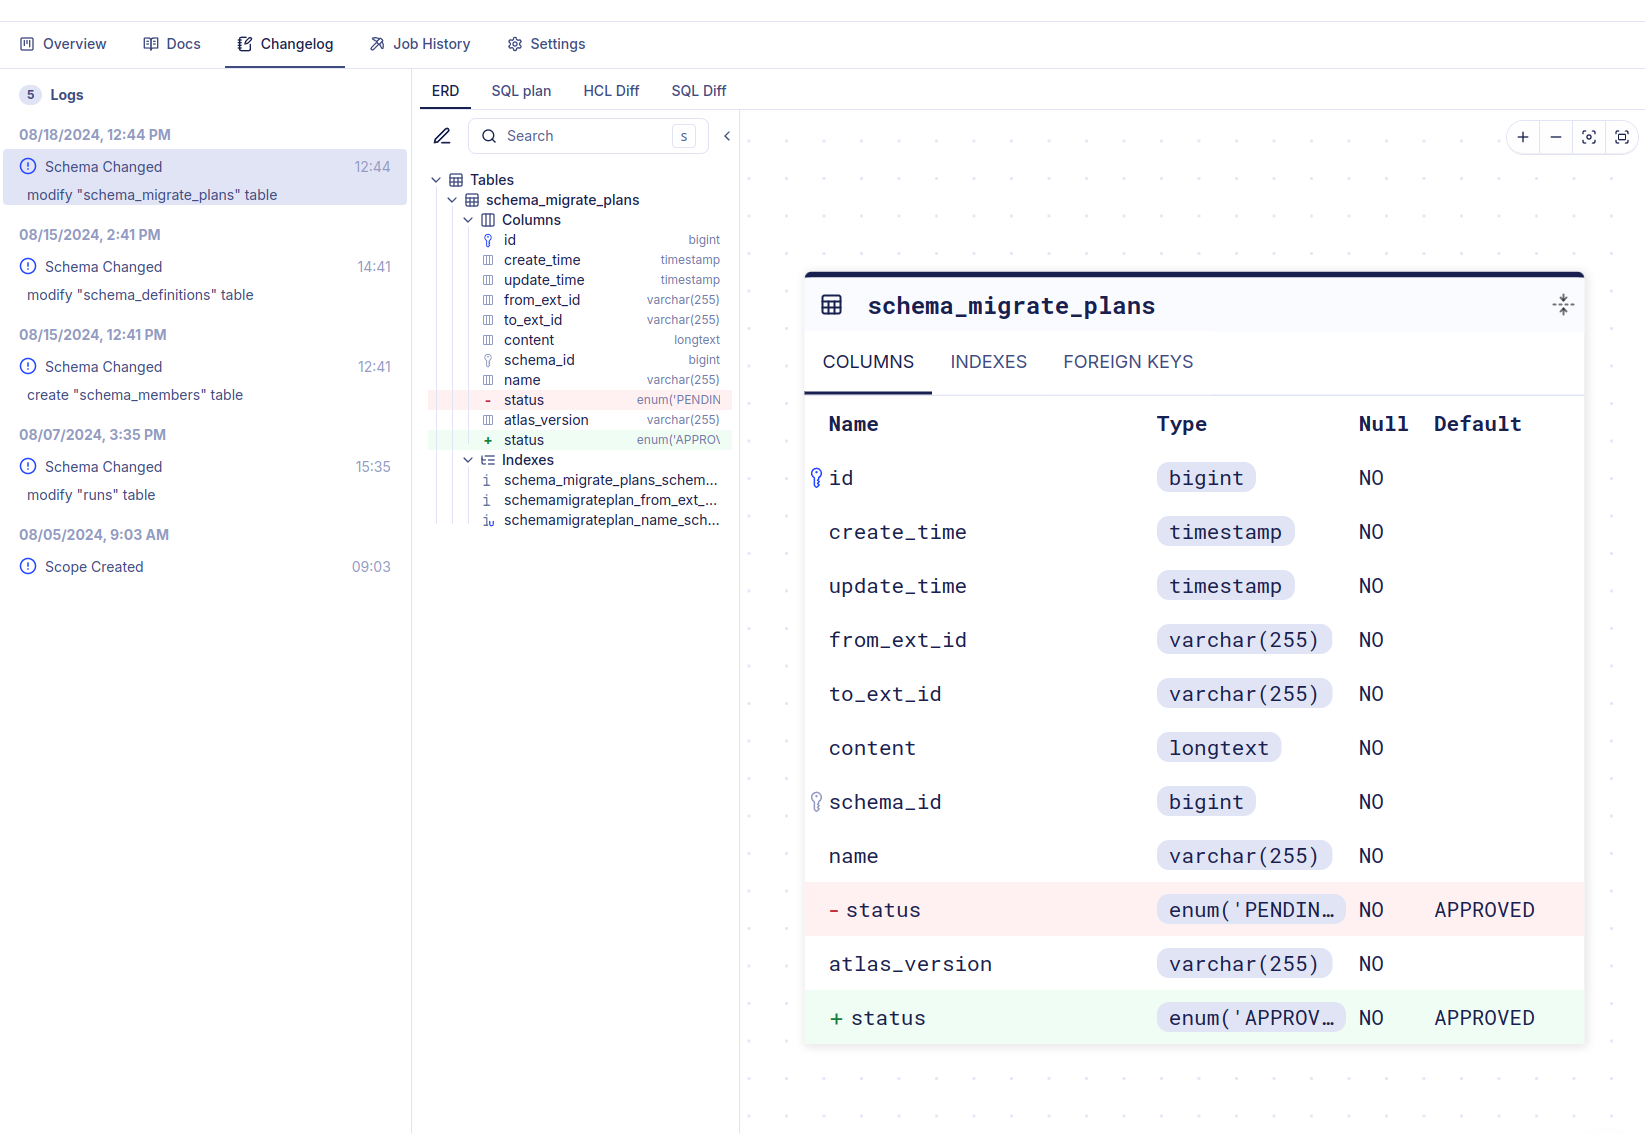
Schema Changelog
Once configured, the Atlas agent periodically checks the database schema. When a change is detected, it reports the change back to the cloud where you can see detailed information about what was modified.
Drift Detection
If you have also set up deployment reporting to Atlas Cloud, Atlas can detect schema drift - when the actual state of your schema doesn't match the expected state. This can happen when someone manually modifies the database schema outside of your normal deployment process. When Atlas detects such drift, you'll see it highlighted in the Change Log.
