Database Security Graph: Permissions, Misconfigurations, and CVEs
Answering "who can access what, and why?" in a real schema usually means cross-referencing GRANT statements,
role memberships, and member_of chains scattered across dozens of migration files. Atlas Registry replaces that
manual audit with a single graph: every object in a repository plotted together, with the inheritance and grant
relationships between them drawn as edges. Where the Lineage Graph
traces how data flows between objects, the Security Graph traces how access flows between them.
How it Works
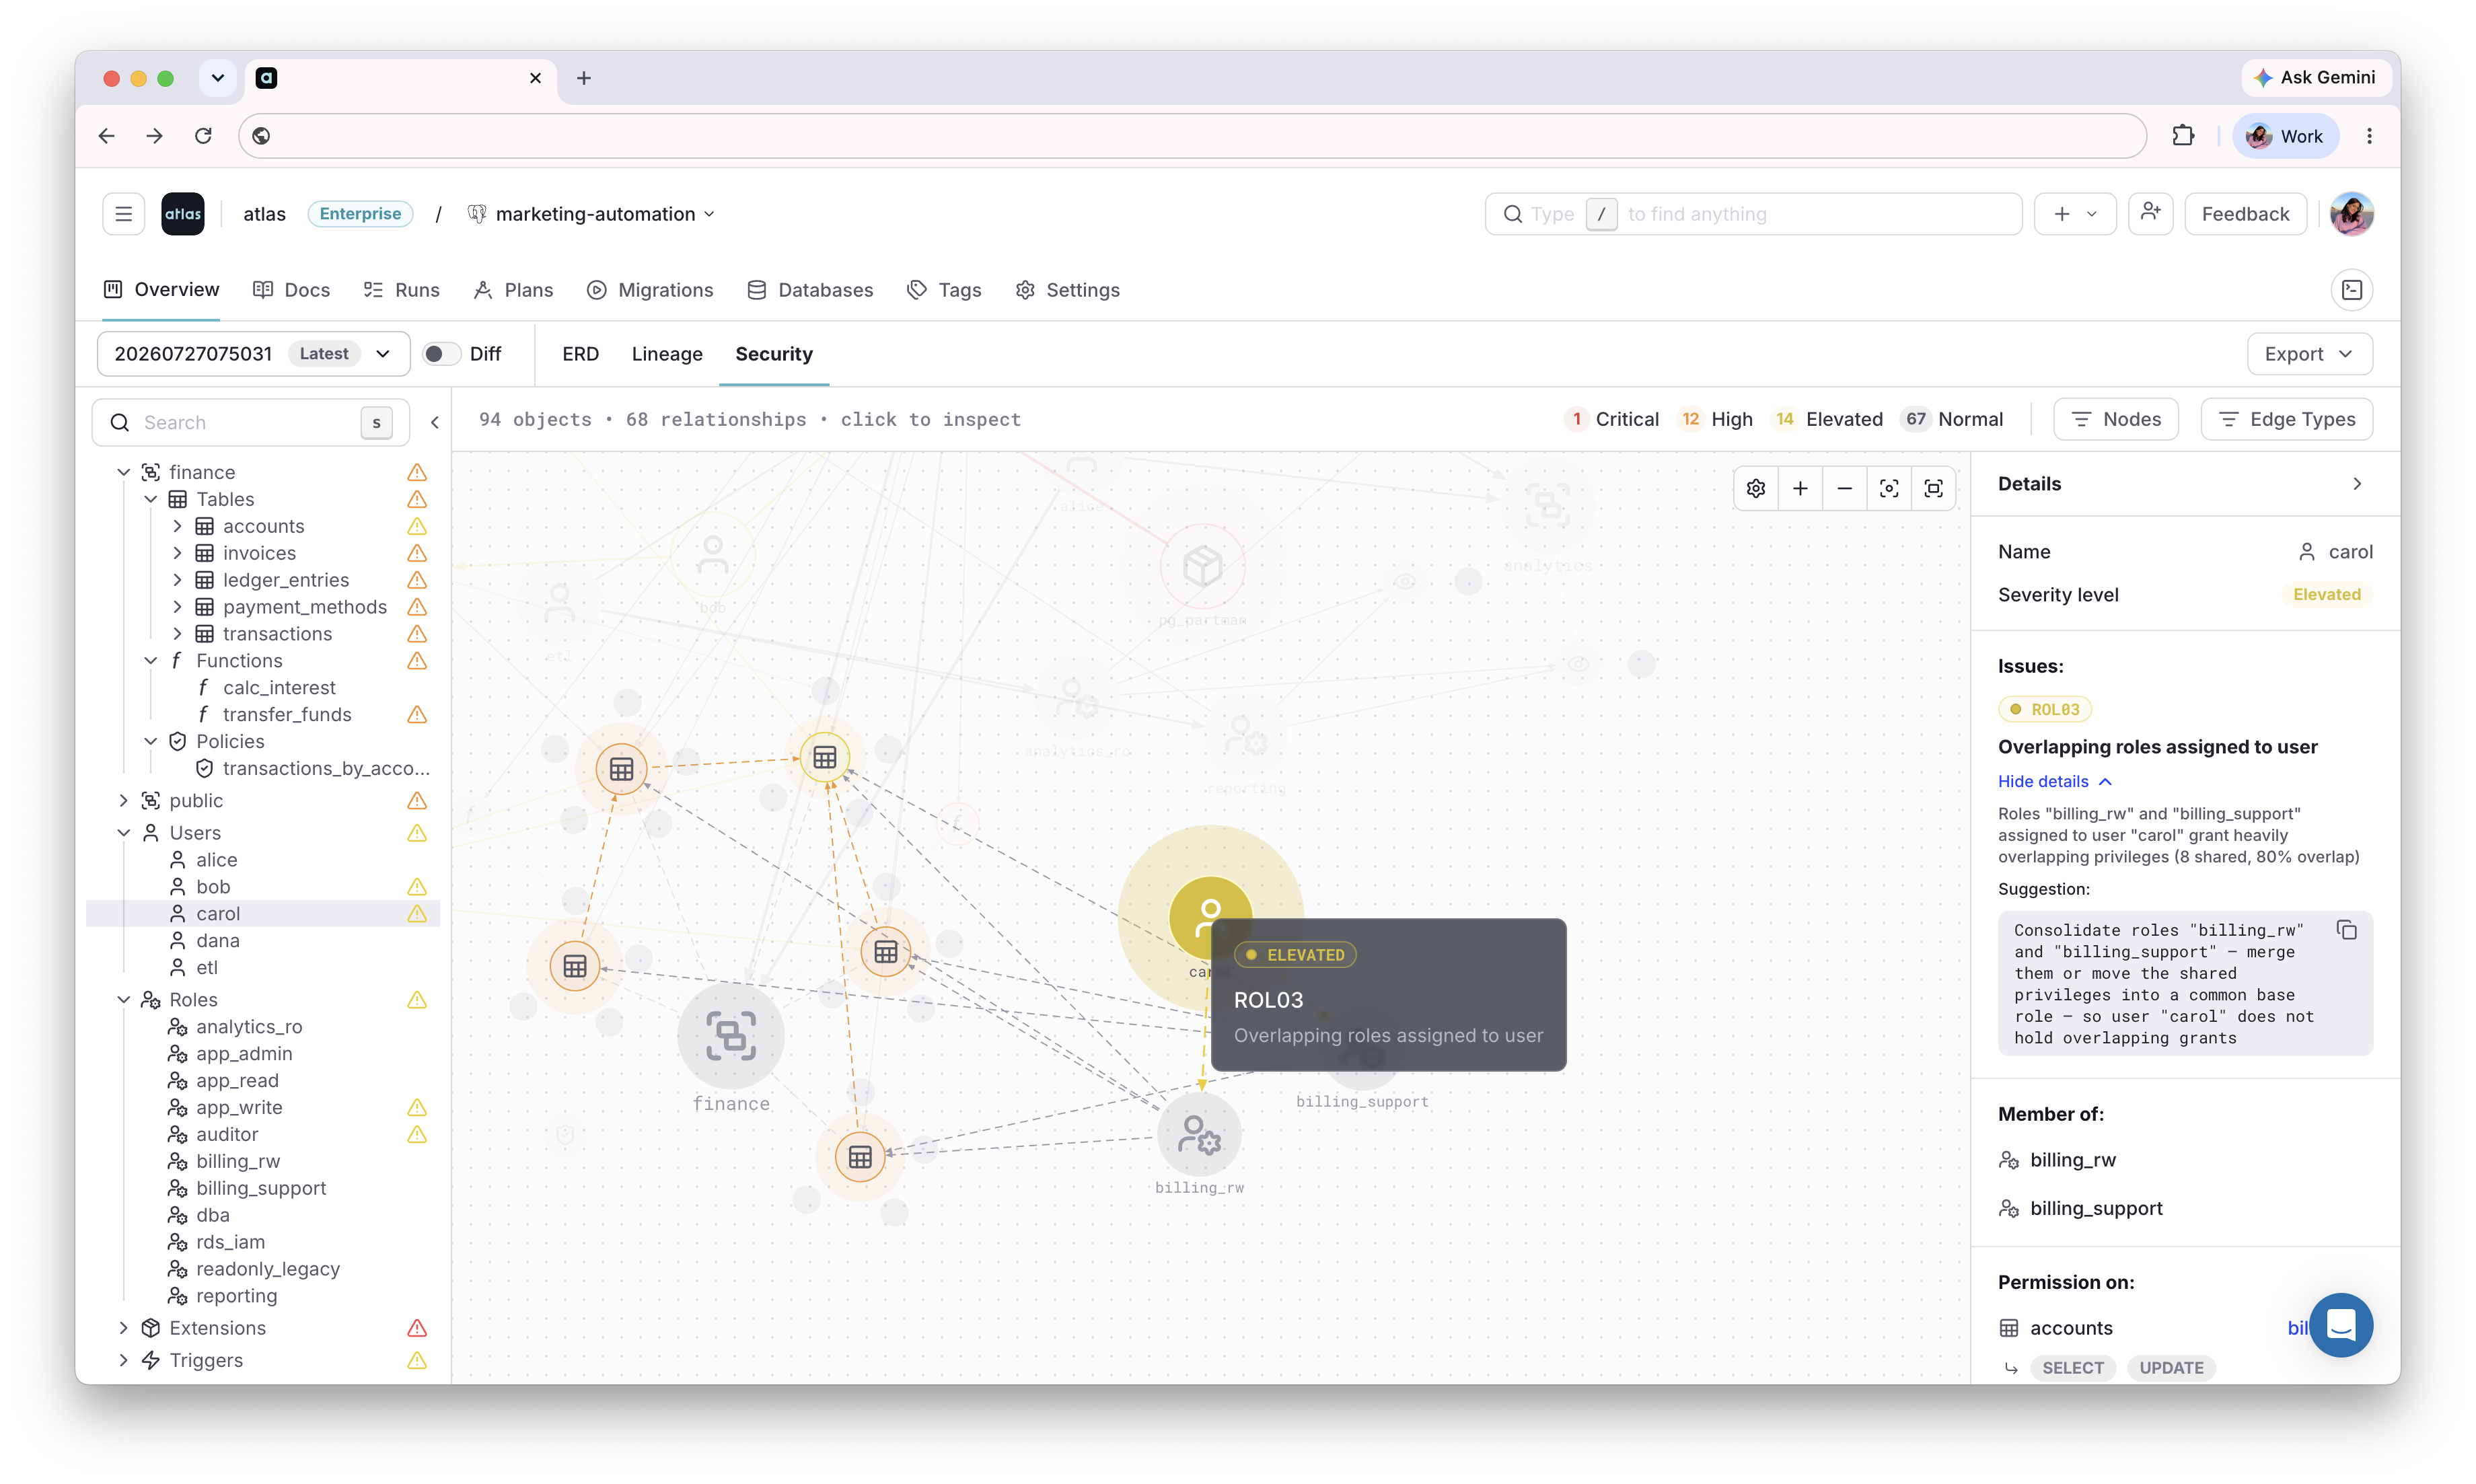
In the project overview, click the Security tab. Atlas will render the security graph for the repository.
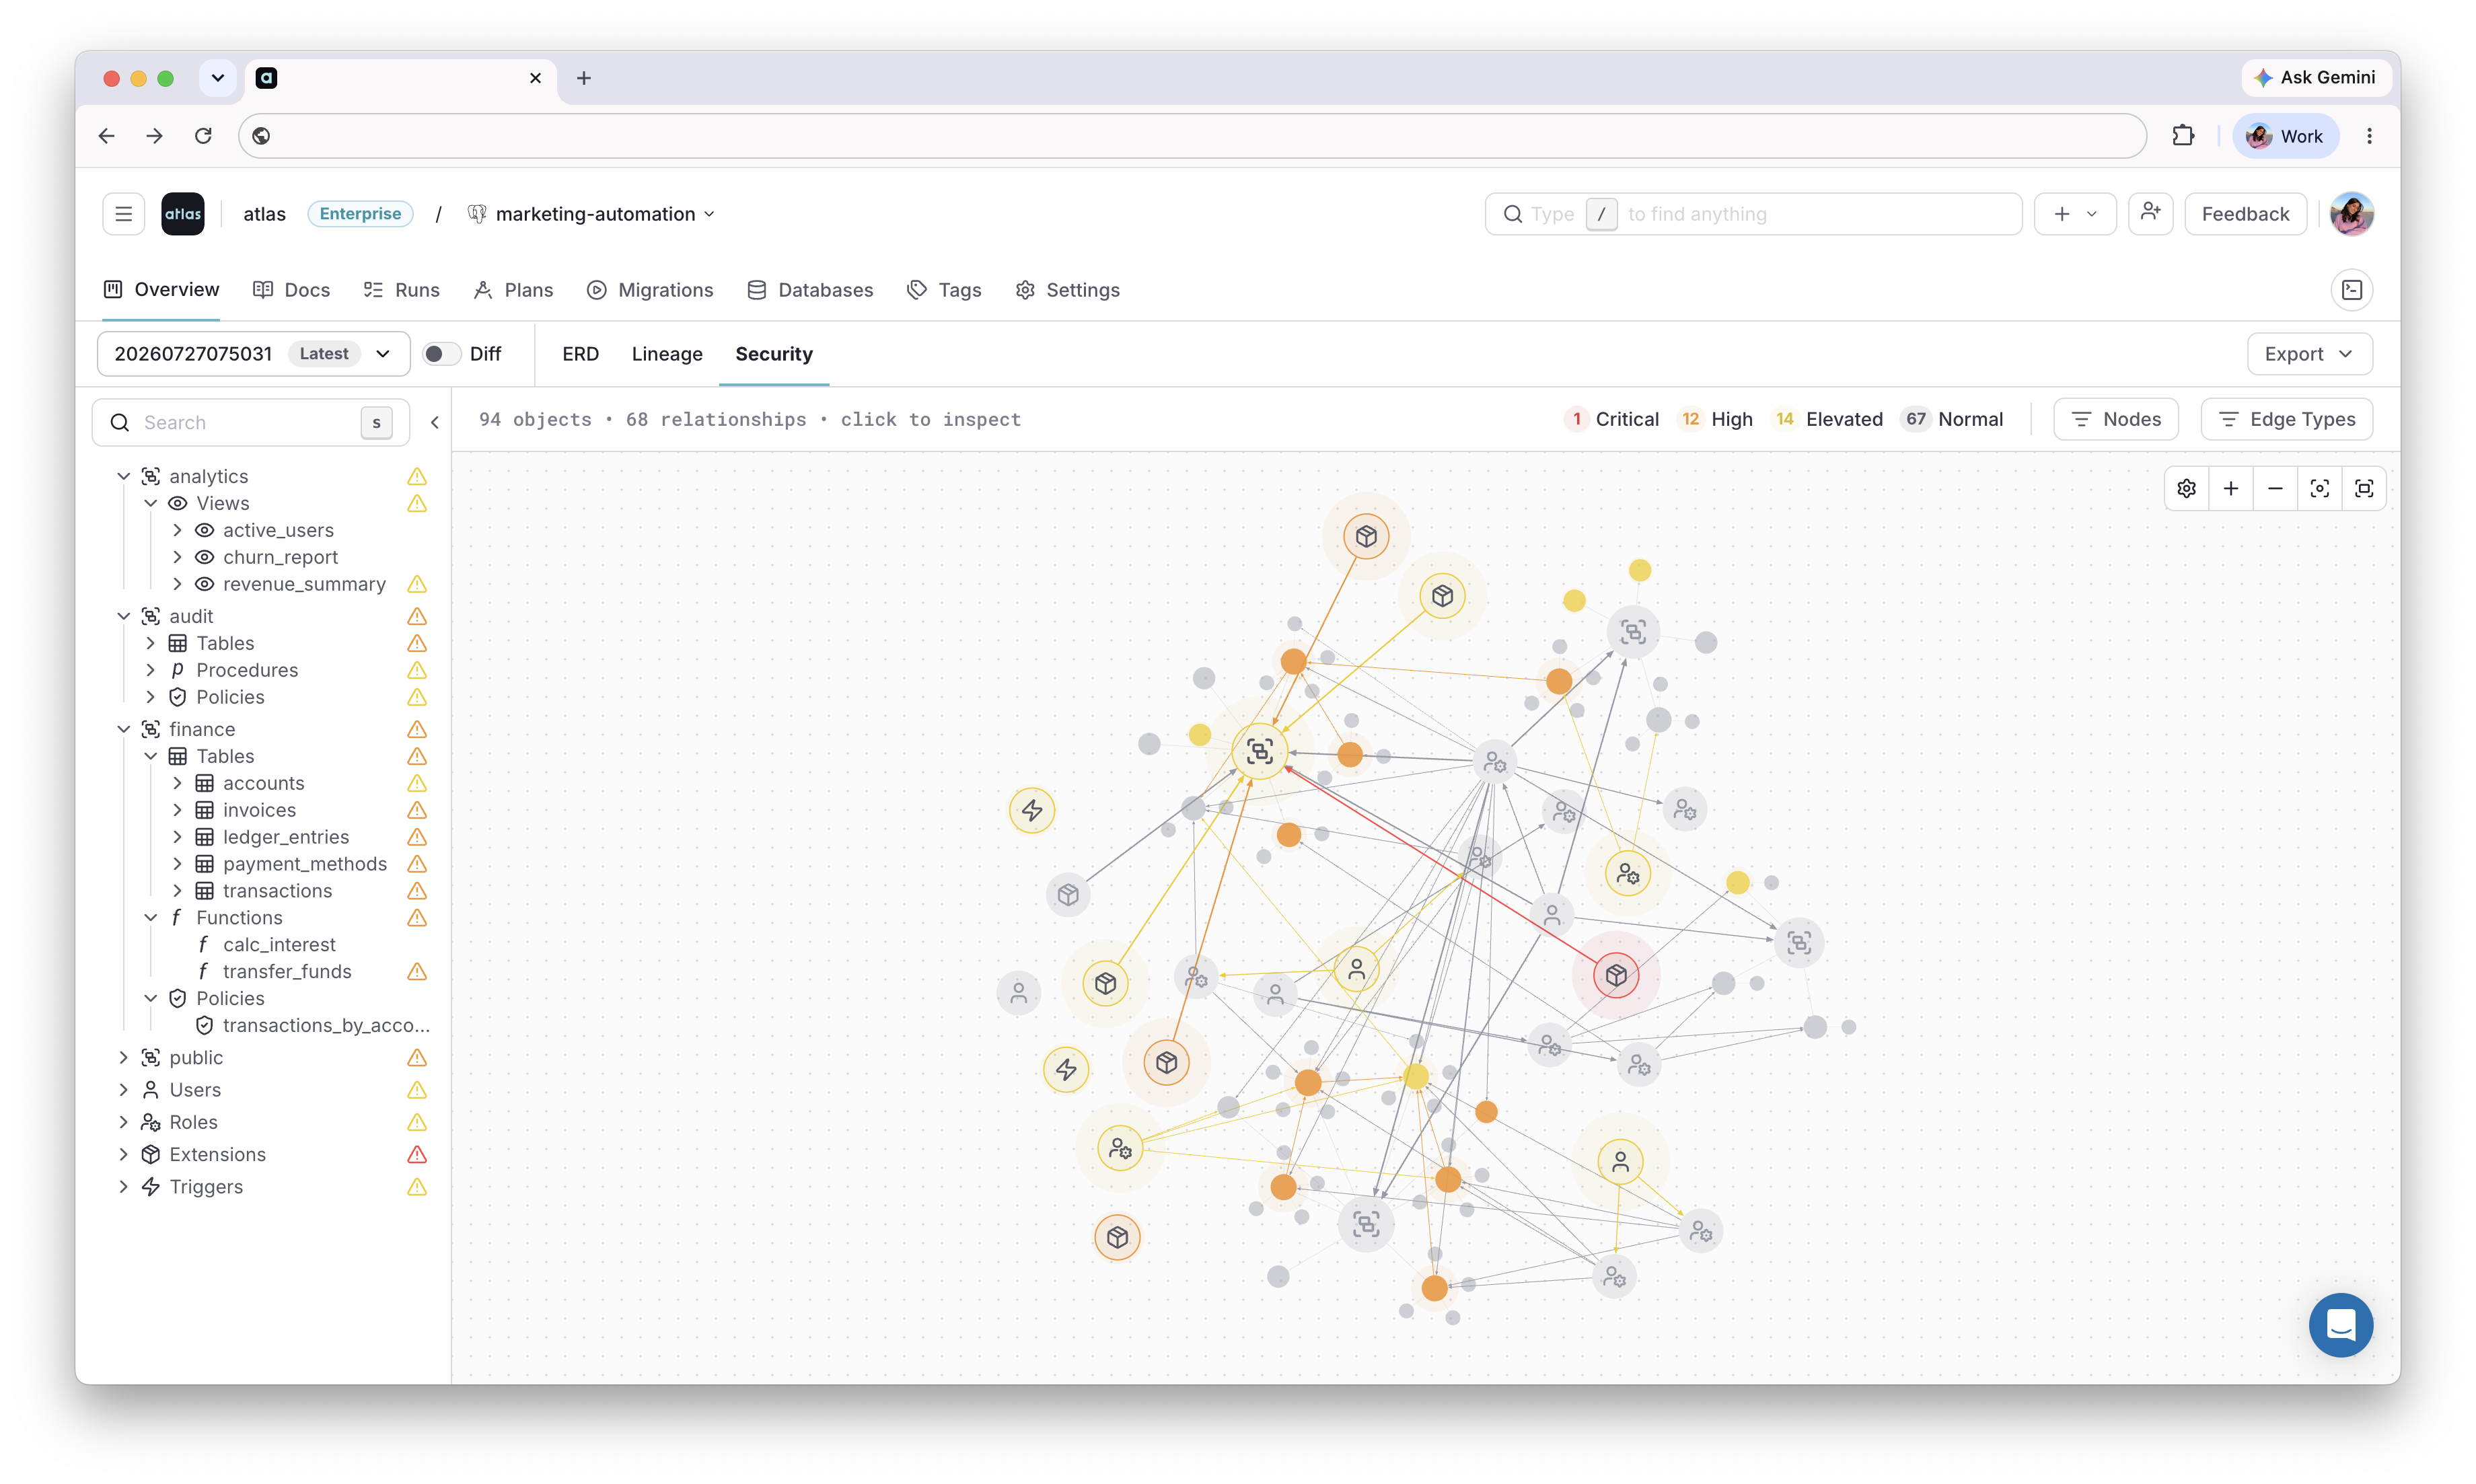
While rendering, Atlas runs its security analyzers against the schema and classifies the results into one of four severities: Critical, High, Elevated, or Normal. Objects in the graph are colored according to their worst applicable finding.
The Security graph works for repositories (schemas and migration directories) and monitored databases, so it reflects what a change is about to introduce, not just what is already live in production.
Read Risk at a Glance
Every object in the graph is colored according to the highest severity found on it, so the color alone tells you how urgently it needs attention:
- Critical (red): A finding that represents a severe, immediate risk, such as a known CVE affecting an installed extension. Review before merging.
- High (orange): A finding that represents a meaningful, exploitable risk. Should be addressed before the change reaches production.
- Elevated (yellow): A finding that widens access or introduces risk under specific conditions. Worth tracking, but unlikely to block a release on its own.
- Normal (gray): No findings, or informational only. No action needed.
Click a node to see the breakdown of analyzer results behind its tier, including the check that was triggered, a description of the risk, and a suggestion for how to fix it. This turns "why is this table orange?" into an actionable next step without leaving the graph or cross-referencing a separate report.
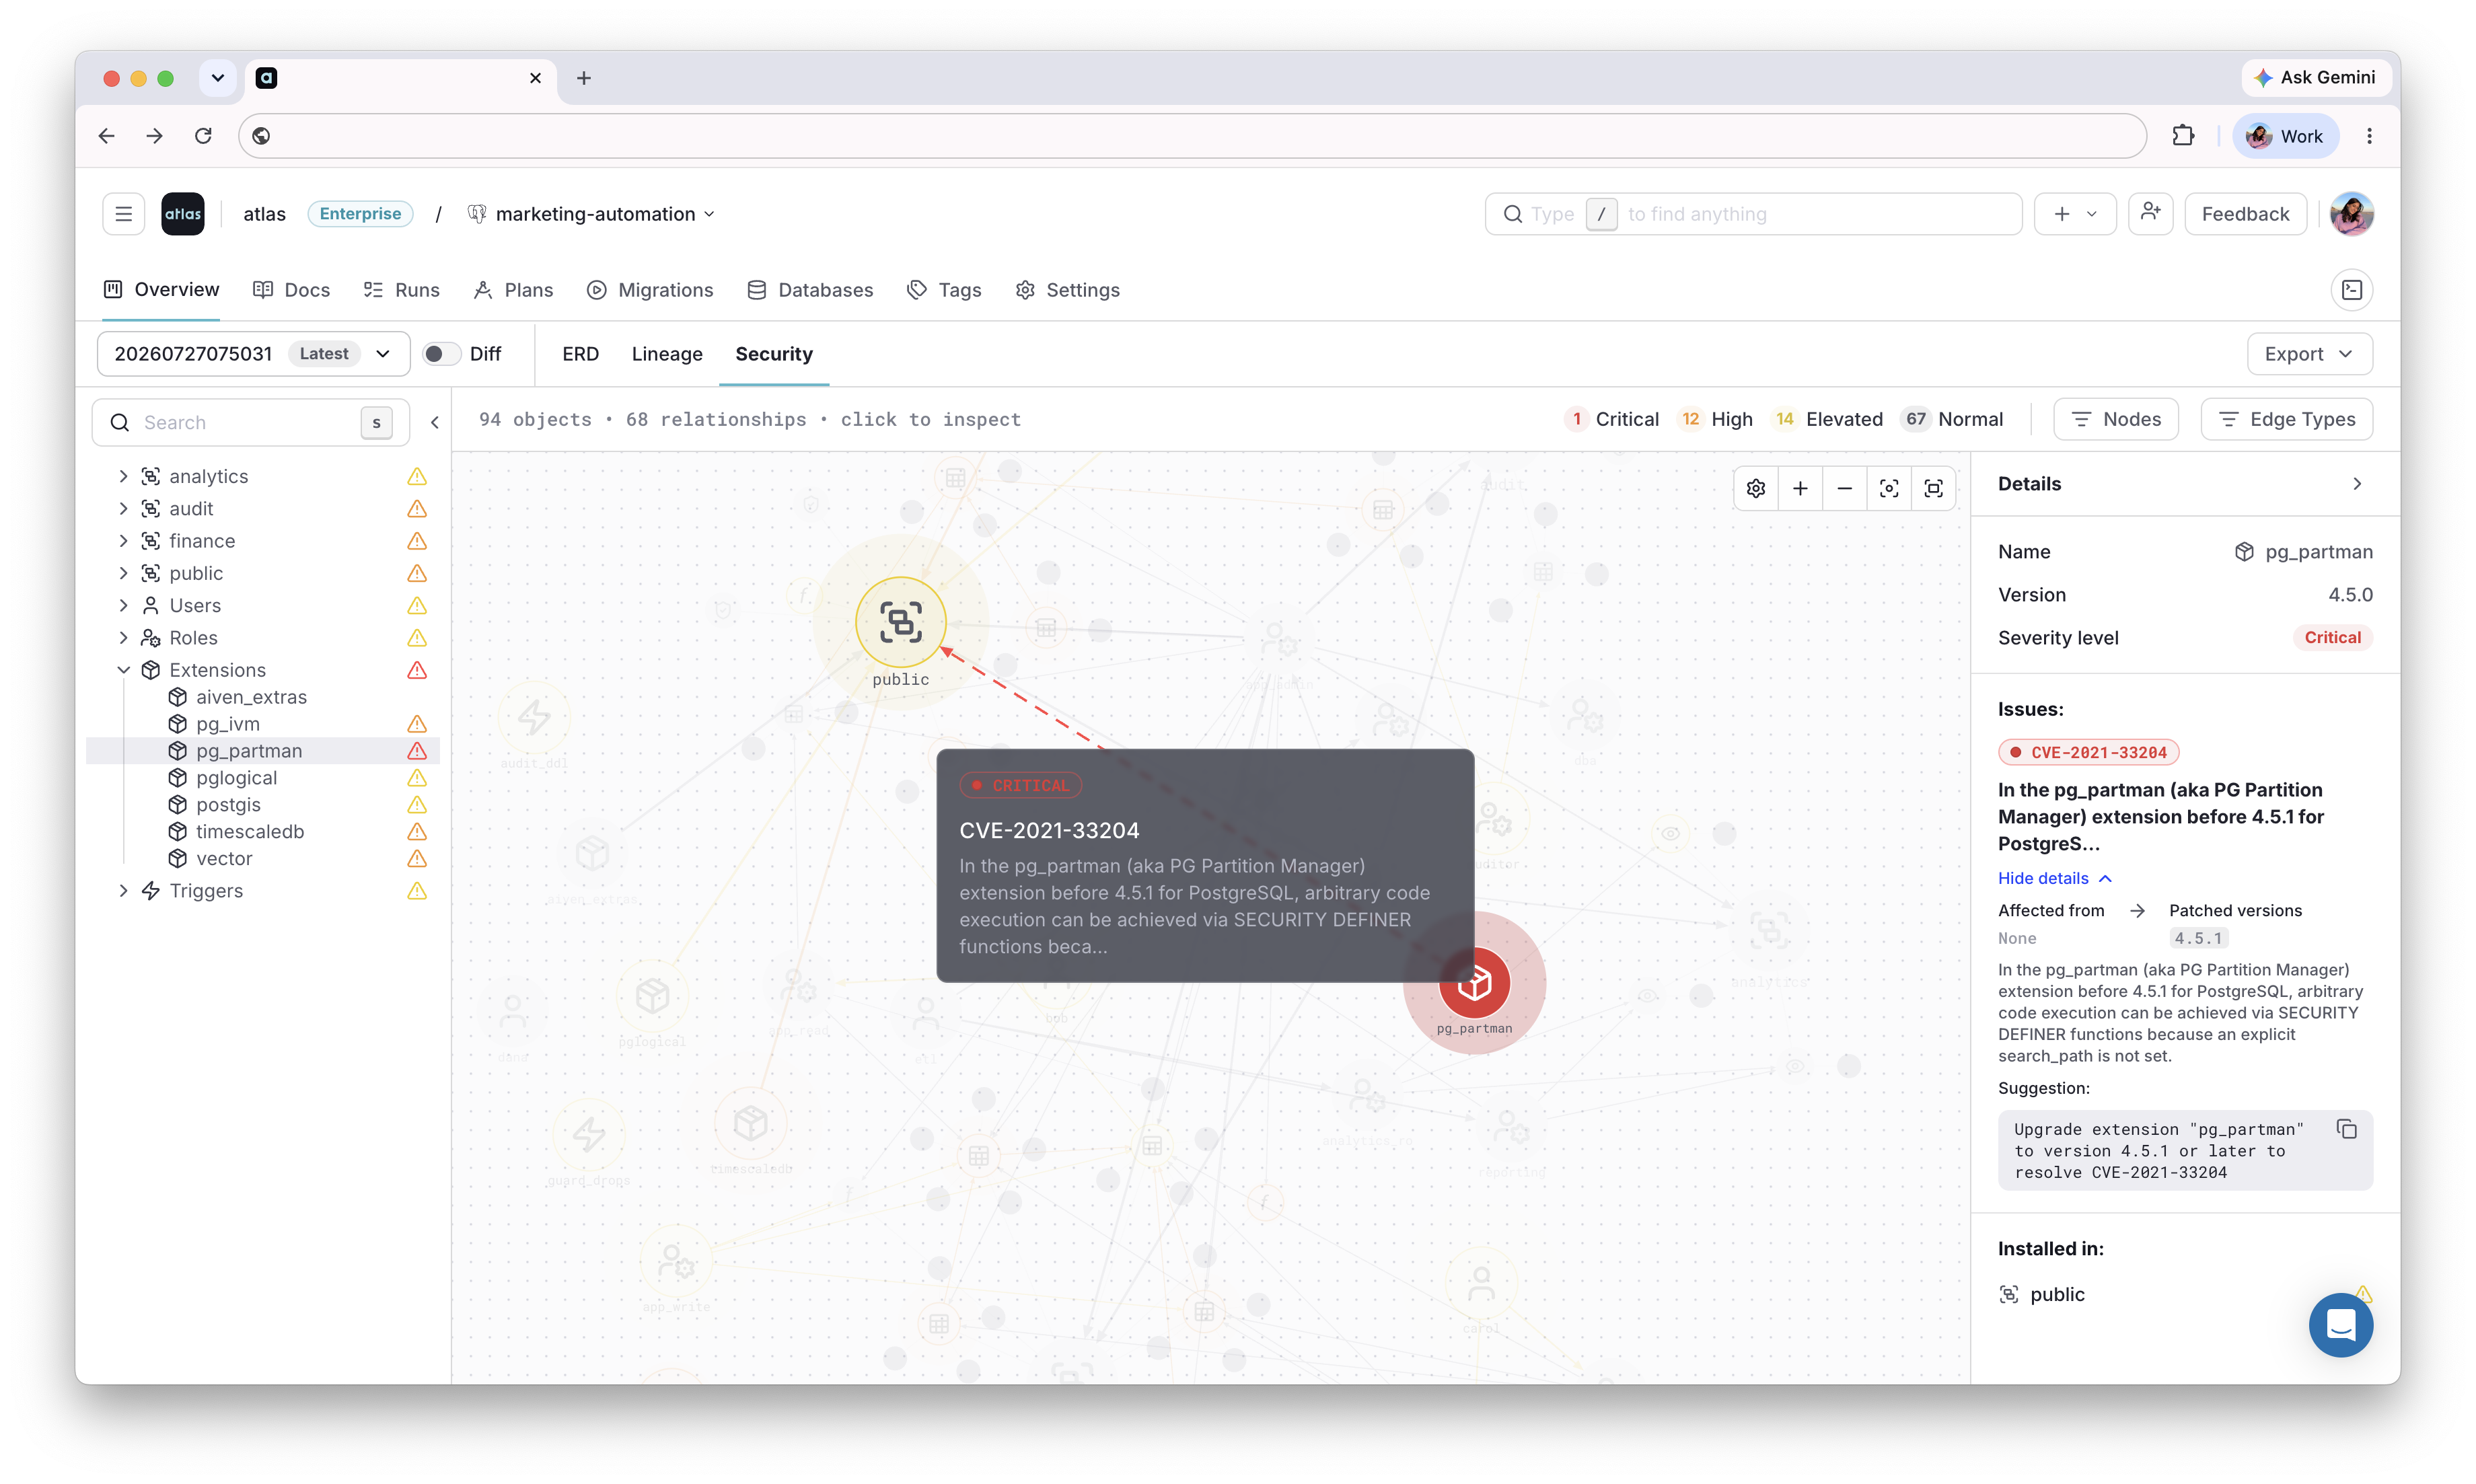
Analyzers span several categories, from grant hygiene to known vulnerabilities to privilege-escalation paths. A few representative examples:
- Grant hygiene: A role or user granted access to a majority of securable objects is Elevated risk, or a
table granted directly to
PUBLICis High risk. - Known vulnerabilities (CVE): An installed extension or engine version matching a published CVE is scored Elevated through Critical based on the CVE's own CVSS severity.
- Row-level security: RLS enabled on a table but not enforced, so the table owner bypasses every policy, is considered Elevated risk.
- Authentication: A user logging in with a static password where IAM authentication is available is Elevated, while a user that can connect with no credential at all is High.
- Privilege escalation: A function or procedure that executes with its definer's privileges instead of the
caller's (
SECURITY DEFINER) is Elevated.
Triage by Risk Tier
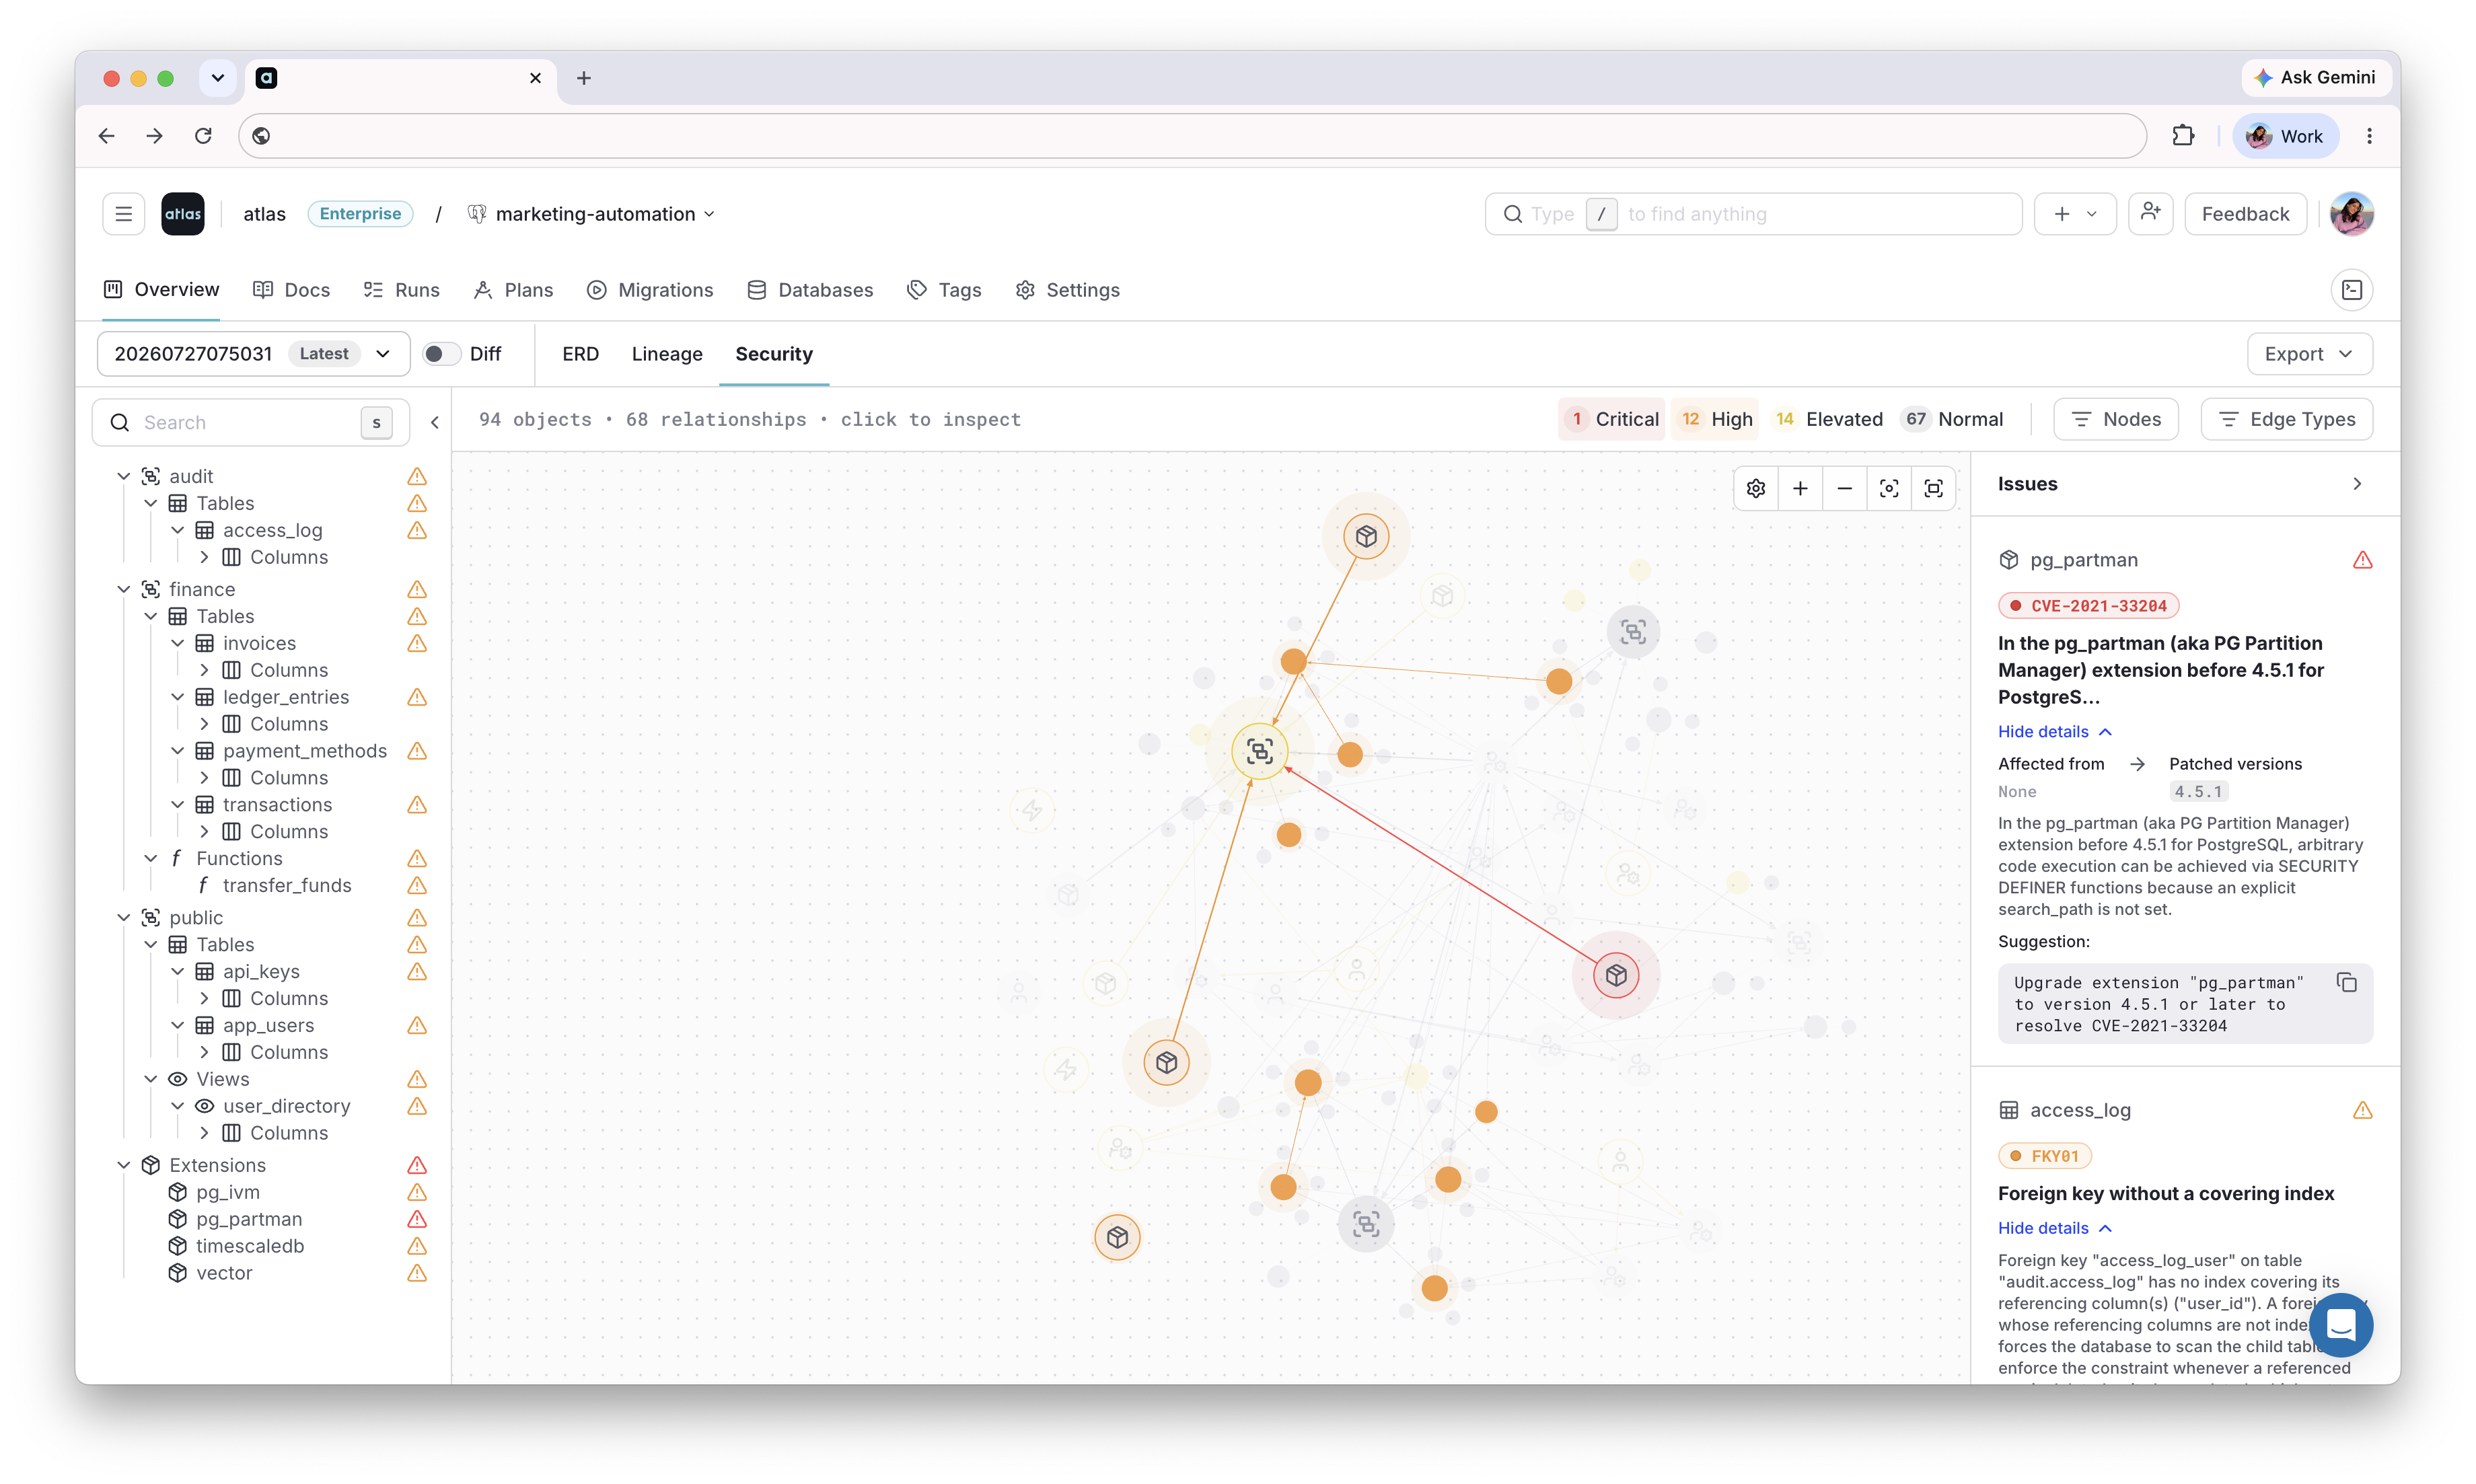
Select a tier tag at the top of the graph to highlight every object at that severity, in both the graph and the right sidebar, so you can work down the severity ladder deliberately: clear every Critical finding first, then High, and so on, instead of fixing whatever happens to be visible first.
Scope the Graph to the Question You're Asking
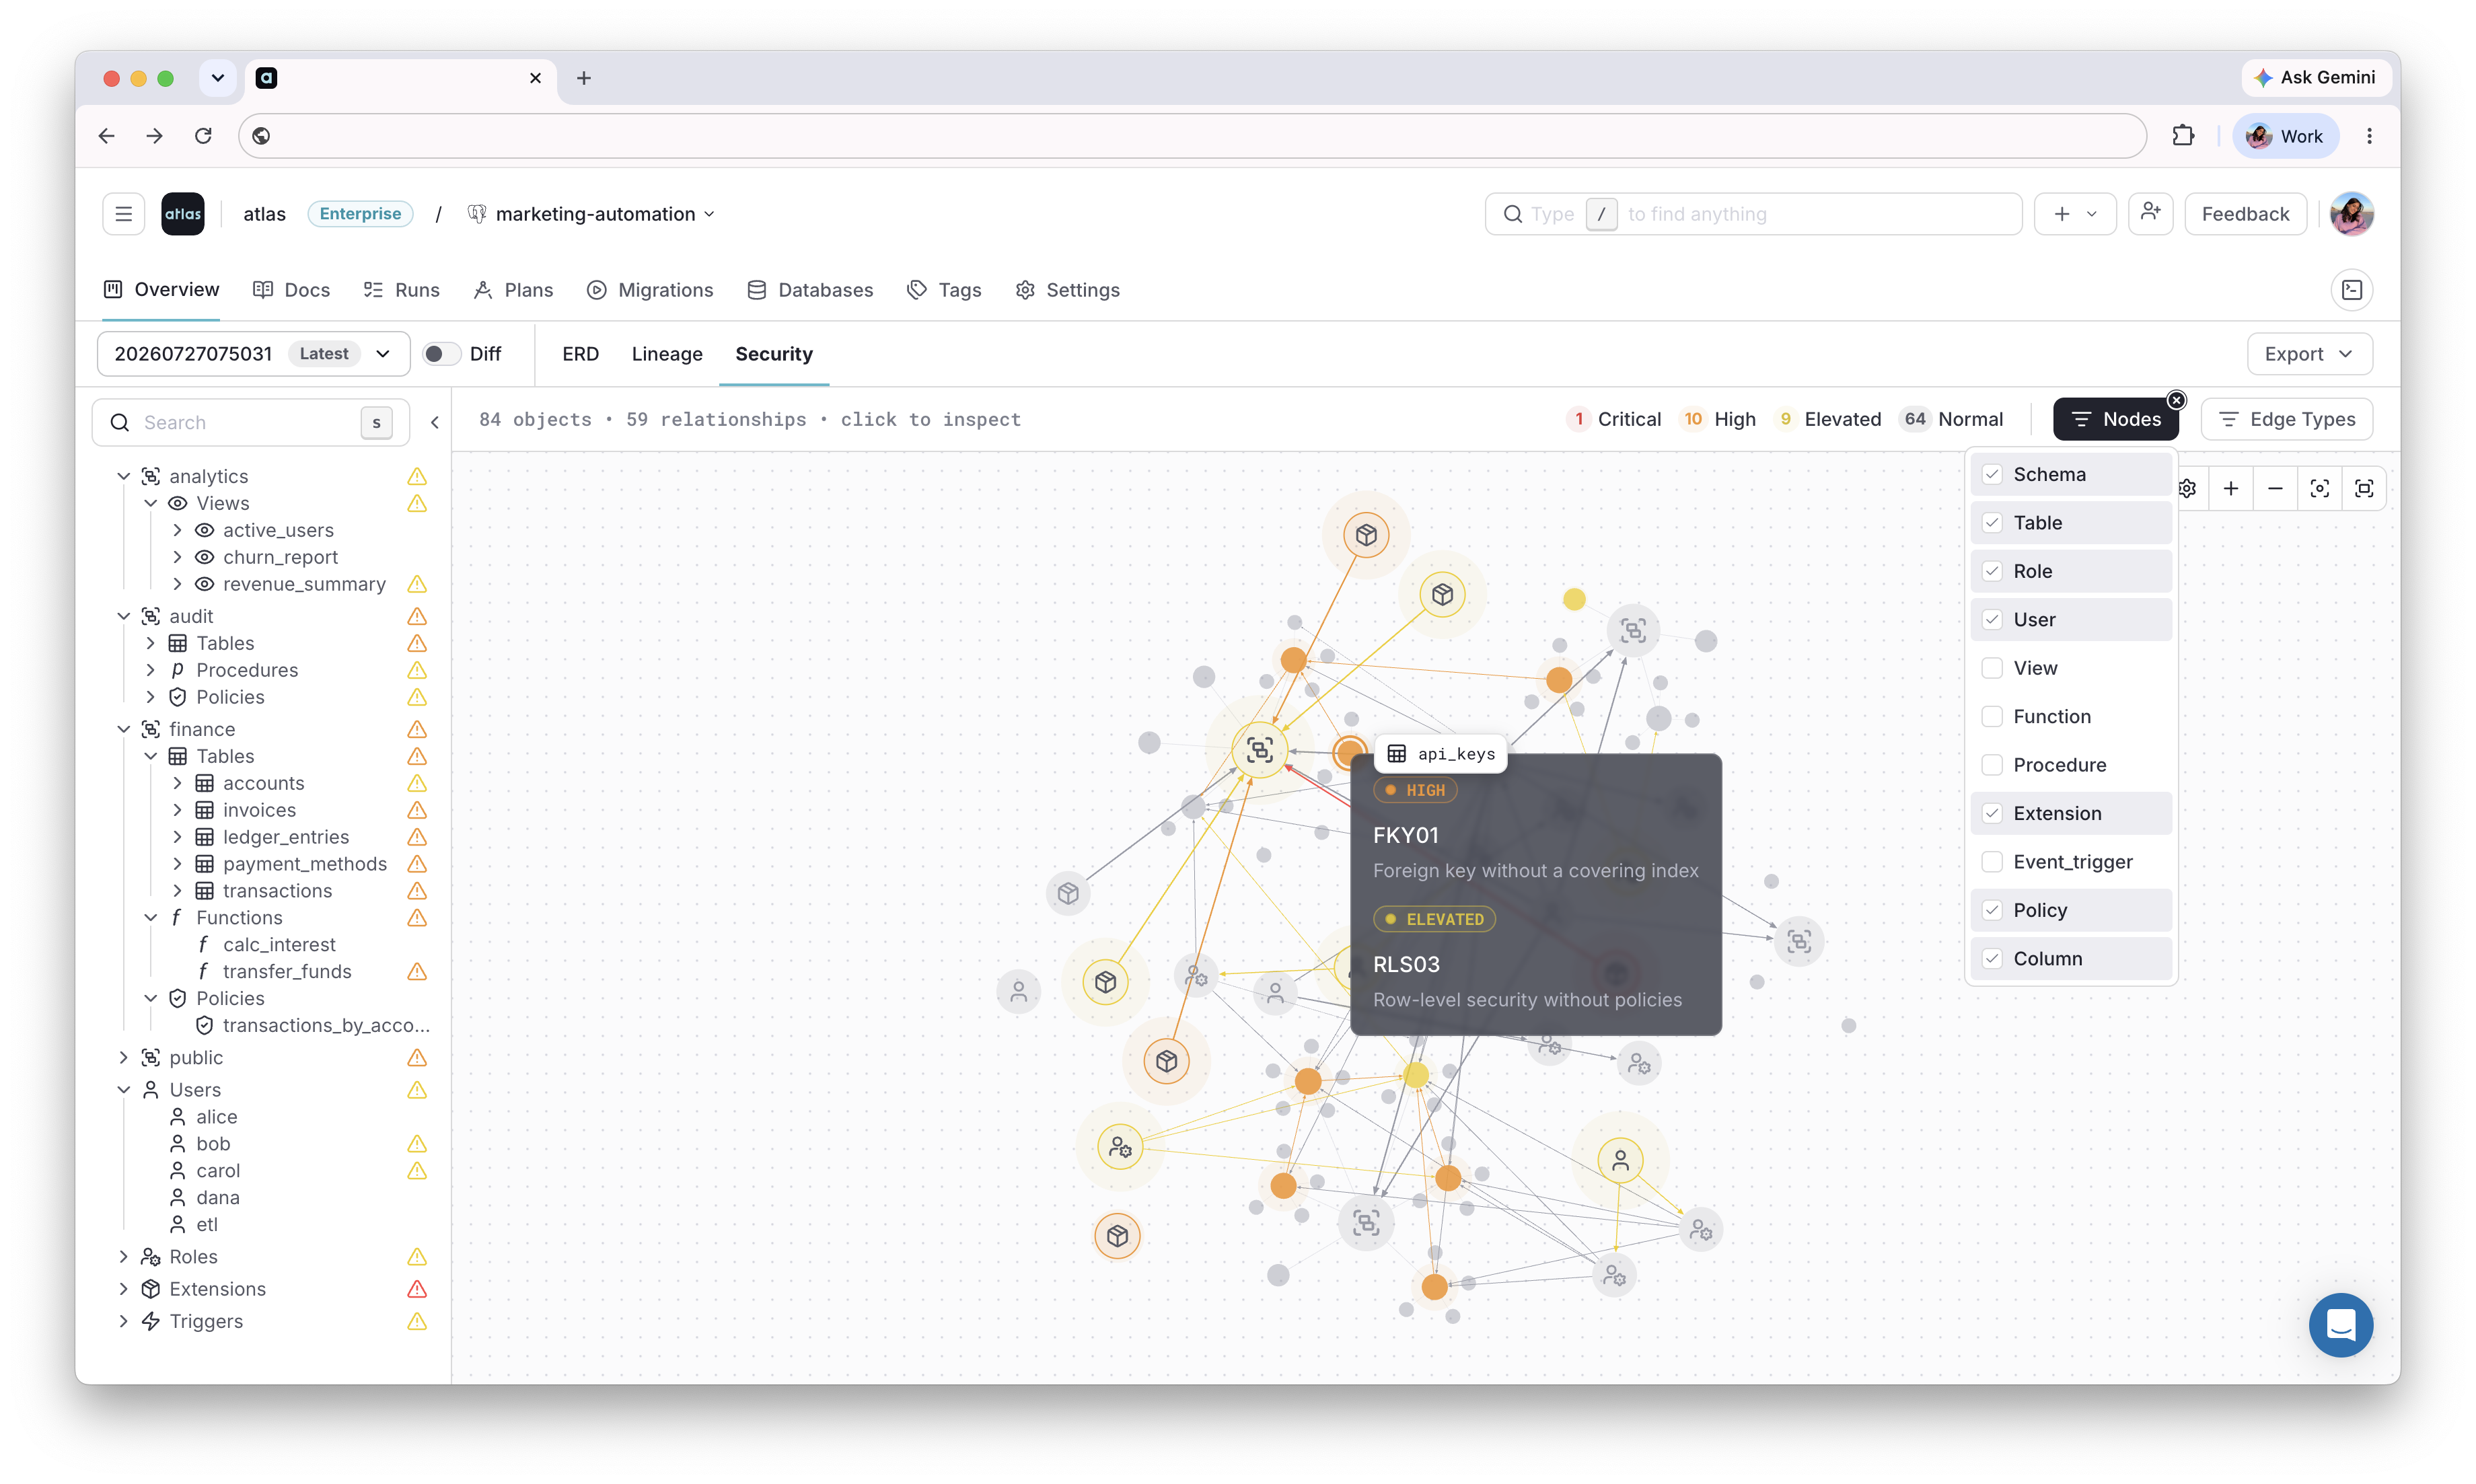
A full security graph mixes access control (who can touch what) with plain schema structure (foreign keys, schema membership, and the like). That's a lot of noise when you only came for one answer. Atlas lets you narrow the graph down to just the objects and relationships that matter for the question at hand:
- Ahead of a compliance audit, strip the graph down to roles and grants alone, and hand the resulting access-control diagram straight to the auditor. It answers "who can touch this data?" without anyone reading through months of migration history.
- Reviewing a PR that introduces a new role, isolate that role and its grants to confirm it only reaches what it's supposed to, with foreign keys and other structural clutter out of the way.
- Chasing down every place a risky extension or function is used, narrow the graph to that object type and see every instance across the repository at a glance, instead of searching schema files one by one.
Trace the Blast Radius
Revoking a role, dropping a grant, or tightening a policy can have consequences well beyond the object you're touching, since privileges inherit transitively through role hierarchies. Selecting an object in the sidebar or on the graph highlights its blast radius: everything it affects or is affected by, traced transitively through inheritance and grants.
This makes the blast radius view useful in two directions: before making a change, to confirm you understand everything it will touch; and after an incident, to answer "if this role were compromised, what could the attacker reach?"
Query from the CLI
Beyond the visual graph, Atlas can export a repository's security graph from the command line for rendering,
programmatic traversal, or ingestion into another tool. The atlas cloud repo secgraph command prints the graph
to stdout as a compact nodes/edges JSON graph.
atlas cloud repo secgraph --slug <slug>
Each node has a stable id, a type, and a name. Findings from the security analyzers are listed under
reports, each with the check that was triggered, a title, a description, and its level
(normal, elevated, high, or critical - this is what determines the node's color in the graph). A data
object carries type-specific metadata, such as the installed version of an extension:
{
  "id": "extension/pg_ivm",
  "type": "extension",
  "name": "pg_ivm",
  "reports": [
    {
      "check": "CVE-2023-22847",
      "title": "",
      "description": "Information disclosure vulnerability exists in pg_ivm versions prior to 1.5.1. An Incrementally Maintainable Materialized View (IMMV) created by pg_ivm may reflect rows with Row-Level Security that the owner of the IMMV should not have access to. As a result, information in tables protected by Row-Level Security may be retrieved by a user who is not authorized to access it.",
      "level": "elevated"
    },
    {
      "check": "CVE-2023-23554",
      "title": "",
      "description": "Uncontrolled search path element vulnerability exists in pg_ivm versions prior to 1.5.1. When refreshing an IMMV, pg_ivm executes functions without specifying schema names. Under certain conditions, pg_ivm may be tricked to execute unexpected functions from other schemas with the IMMV owner's privilege. If this vulnerability is exploited, an unexpected function provided by an attacker may be executed with the privilege of the materialized view owner.",
      "level": "high"
    }
  ],
  "data": {
    "version": "1.0.0"
  }
}
Since the graph prints in JSON, it drops straight into a CI gate, a script, or an AI coding agent's context, no
UI required. Pipe the output to jq to query it directly. For example, fail a pipeline if any object has a
Critical finding:
atlas cloud repo secgraph --slug <slug> | jq '.nodes[] | select(.reports[]?.level == "critical")'
Next Steps
- Security as Code - define the roles, grants, and policies this graph visualizes, as code